When I think of storytelling, I think of autobiographies and biographies that tell a life story. However, over the past few years, I learned that storytelling has a broader purpose in transformation efforts and is a critical component of process improvement work.
Being a skilled storyteller helps garner support from leaders, key stakeholders, and motivates others.
There are typically three parts to a story — setting, plot, and character(s). While in traditional storytelling, these parts make sense, transformational storytelling requires a different approach.
Key Elements
When communicating the efforts of a process improvement team, the key components to convey are:
Background and Current State
- A clear description of the process problem, its impact (customers, operational, financial, social, environmental, etc.), and the business case for why it should be addressed now (known as the ‘burning platform’).
- How the problem is measured and the expected improvement goal(s).
- Quantification of the magnitude of the process problem using accurate and relevant data.
Analysis
- The critical root causes that are contributing to the process problem (validated through logical and data-based methods).
Solutions (Countermeasures) and Implementation
- The solutions that were identified and implemented to address validated root causes.
- Quantified project results using accurate and relevant process data, and any associated financial benefits as a result of the solutions that were implemented.
Follow Up/Sustainment
- A sustainment plan to ensure the operational and financial results are preserved, lessons learned, and suggestions for other improvement opportunities.
Various frameworks are used, such as DMAIC (Define, Measure, Analyze, Improve, Control) and A3, to communicate a team’s progress. While these are still commonly used, many practitioners struggle with being able to succinctly and visually tell the story of their project efforts. After coaching over 180 transformation projects, here are some tips to help you and your team enhance your storytelling skills.
Planning the Story
- Know your audience and determine what information is relevant to them. Keep only pertinent information in the main body of the story and have supporting information in at the end, if needed. This is especially important if you are presenting the information to senior leaders who have limited time and need to focus on key facts.
- Make logical links between key story elements that tie it all together. For example, if you are focused on the Analysis component of the story, provide a brief summary of the Current State (i.e., description of the magnitude of the problem) at the beginning to lead into the Analysis section.
Telling the Story
- Begin with a brief background of the project that includes the area of the organization (business unit, location, function, etc.), the operational process being addressed, and recent and relevant historical data that clearly illustrates the performance gap and its impact to customers, the organization, regulatory requirements, etc.
- Limit the use of written statements to describe findings but use data in the form of graphs and chart
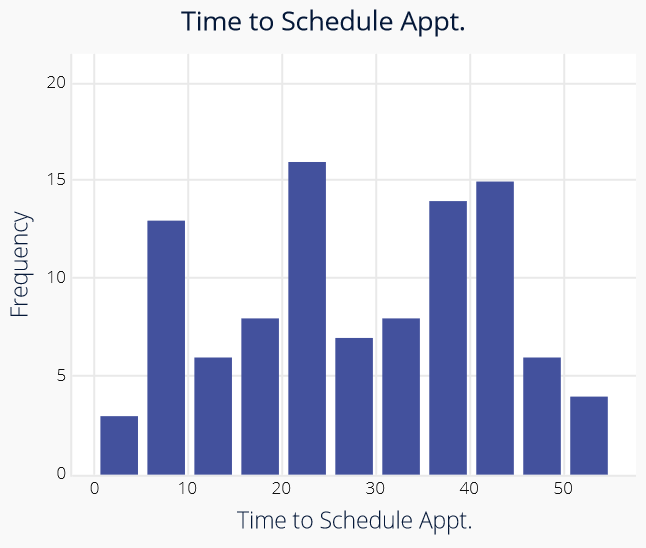
 s to convey your key points. For example, in a healthcare setting, instead of a statement like “the average time to schedule patients is 28 days,” use a trend chart or histogram of sampled raw data to examine the time it takes to schedule patients for their appointments. Using these graphical tools, you describe not only the average (or center) but also shows the spread/variation of the process, such as “patients are waiting between 4 and 52 days to schedule an appointment.” Histograms and trend charts can also visually show how the current scheduling time compares to a target value.
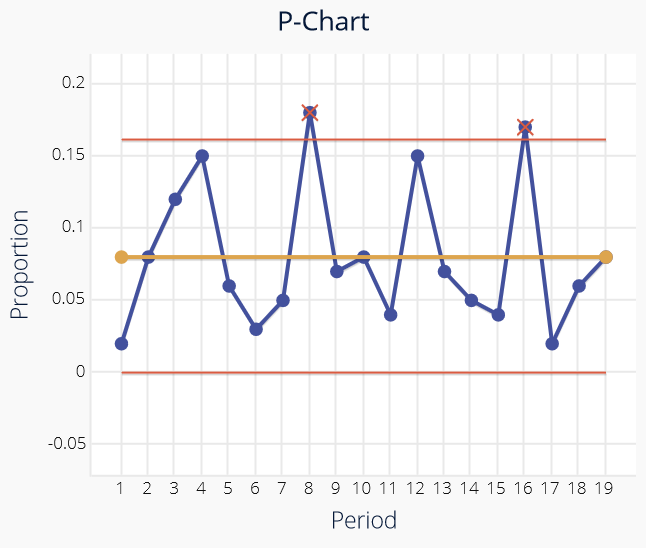
- When using graphical illustrations of data, add brief written summaries to highlight the key points about what the graph tells you about the process. For example, if a control chart is used to
 show the weekly percentage of calls to a swift response servicing team that require follow-ups (more than one touch, extra processing, etc.), include a statement that describes your conclusion. “The percentage of calls to the swift response team that needs follow-up is typically between 2–15%, averaging 8%, and peaks as high as 18% during the first week of the month due to payment statements being sent out on the 3rd business day.”
 - When describing the actions taken by your team during a phase or part of the project, focus on detailing the learnings versus the action. As an example, instead of saying, “we did a detailed process map,” explain what you learned from doing the process map — “we learned there are four handoffs, and there are no guidelines to handle this scenario.”
- Minimize jargon. It is easy to include too much jargon in transformational storytelling, especially with all the various tools and terms associated with methodologies like Lean and Six Sigma. Build your story around who your audience is and minimize excessive jargon the audience may not understand. For example, if you are presenting the current state of process performance and performing capability analysis such as Sigma level and DPMO, focus on the conclusions from the analyses rather than the technical terms. Instead of “the process to schedule patients has a 2.4 sigma level and 184,060 DPMO”, adjust the language to something like “18.4% of our patients are not being scheduled within our 20-day target timeframe, which means that for a panel of 1,000 patients, 184 of them will wait longer than 20 days to be scheduled.”
Closing the Story
- When ending your story, close the discussion with an action for the audience. Asking a question like “do we have your approval to proceed?” is a great way to get a decision quickly.
You may tell the story of your transformation project several times throughout its course, as well as to various audiences — keep these tips in mind to help you plan, tell, and close the story each time.
The histogram and control chart were created using EngineRoom, a web-based data analysis software from our friends at MoreSteam.

